The magic of radio wave propagation
Imagine a beam of light racing around Earth's equator at 299,702,547 meters per second. In just 0.134 seconds, it would complete the journey and hit us in the back. The calculation is straightforward:
$$T = \dfrac{40075000}{299702547} = 0.13371591399 \text{ seconds}$$
But here is where things get interesting: while light travels in straight lines and disappears beyond the horizon due to Earth's curvature, radio waves in the High Frequency (HF) band (3–30 MHz) have a special trick up their sleeve. They can bounce off the ionosphere — a layer of charged particles in Earth's upper atmosphere — allowing them to travel far beyond the horizon.
This remarkable property of HF radio waves enables long-distance communication without wires or satellites. Because these waves follow predictable paths through the atmosphere, we can actually calculate how far away a radio signal originated. All we need is a reference time to compare the signal against, and we can determine the source's distance with surprising accuracy.
That is the backdrop for this post. WWV (Fort Collins, Colorado) and WWVH (Kekaha, Hawaii) are NIST time-standard stations. On 15 MHz they each mark the top of every UTC minute with an 800 ms pulse. From most of North America you often hear both pulses in the same minute — WWV first, then WWVH roughly 19–20 ms later, the extra path length from Hawaii showing up as a delay you can measure in the RF envelope.
The analysis below walks through a short IQ recording: build a spectrogram, stack the minute-start pulses, model the pulse shape with smooth logistic edges, and fit a Bayesian model to recover the delay and watch WWVH fade over a few minutes while WWV holds steady.
Spectrogram of five minutes on 15 MHz
The recording was processed into a waterfall plot — time on the vertical axis, offset frequency on the horizontal axis, colour showing power:
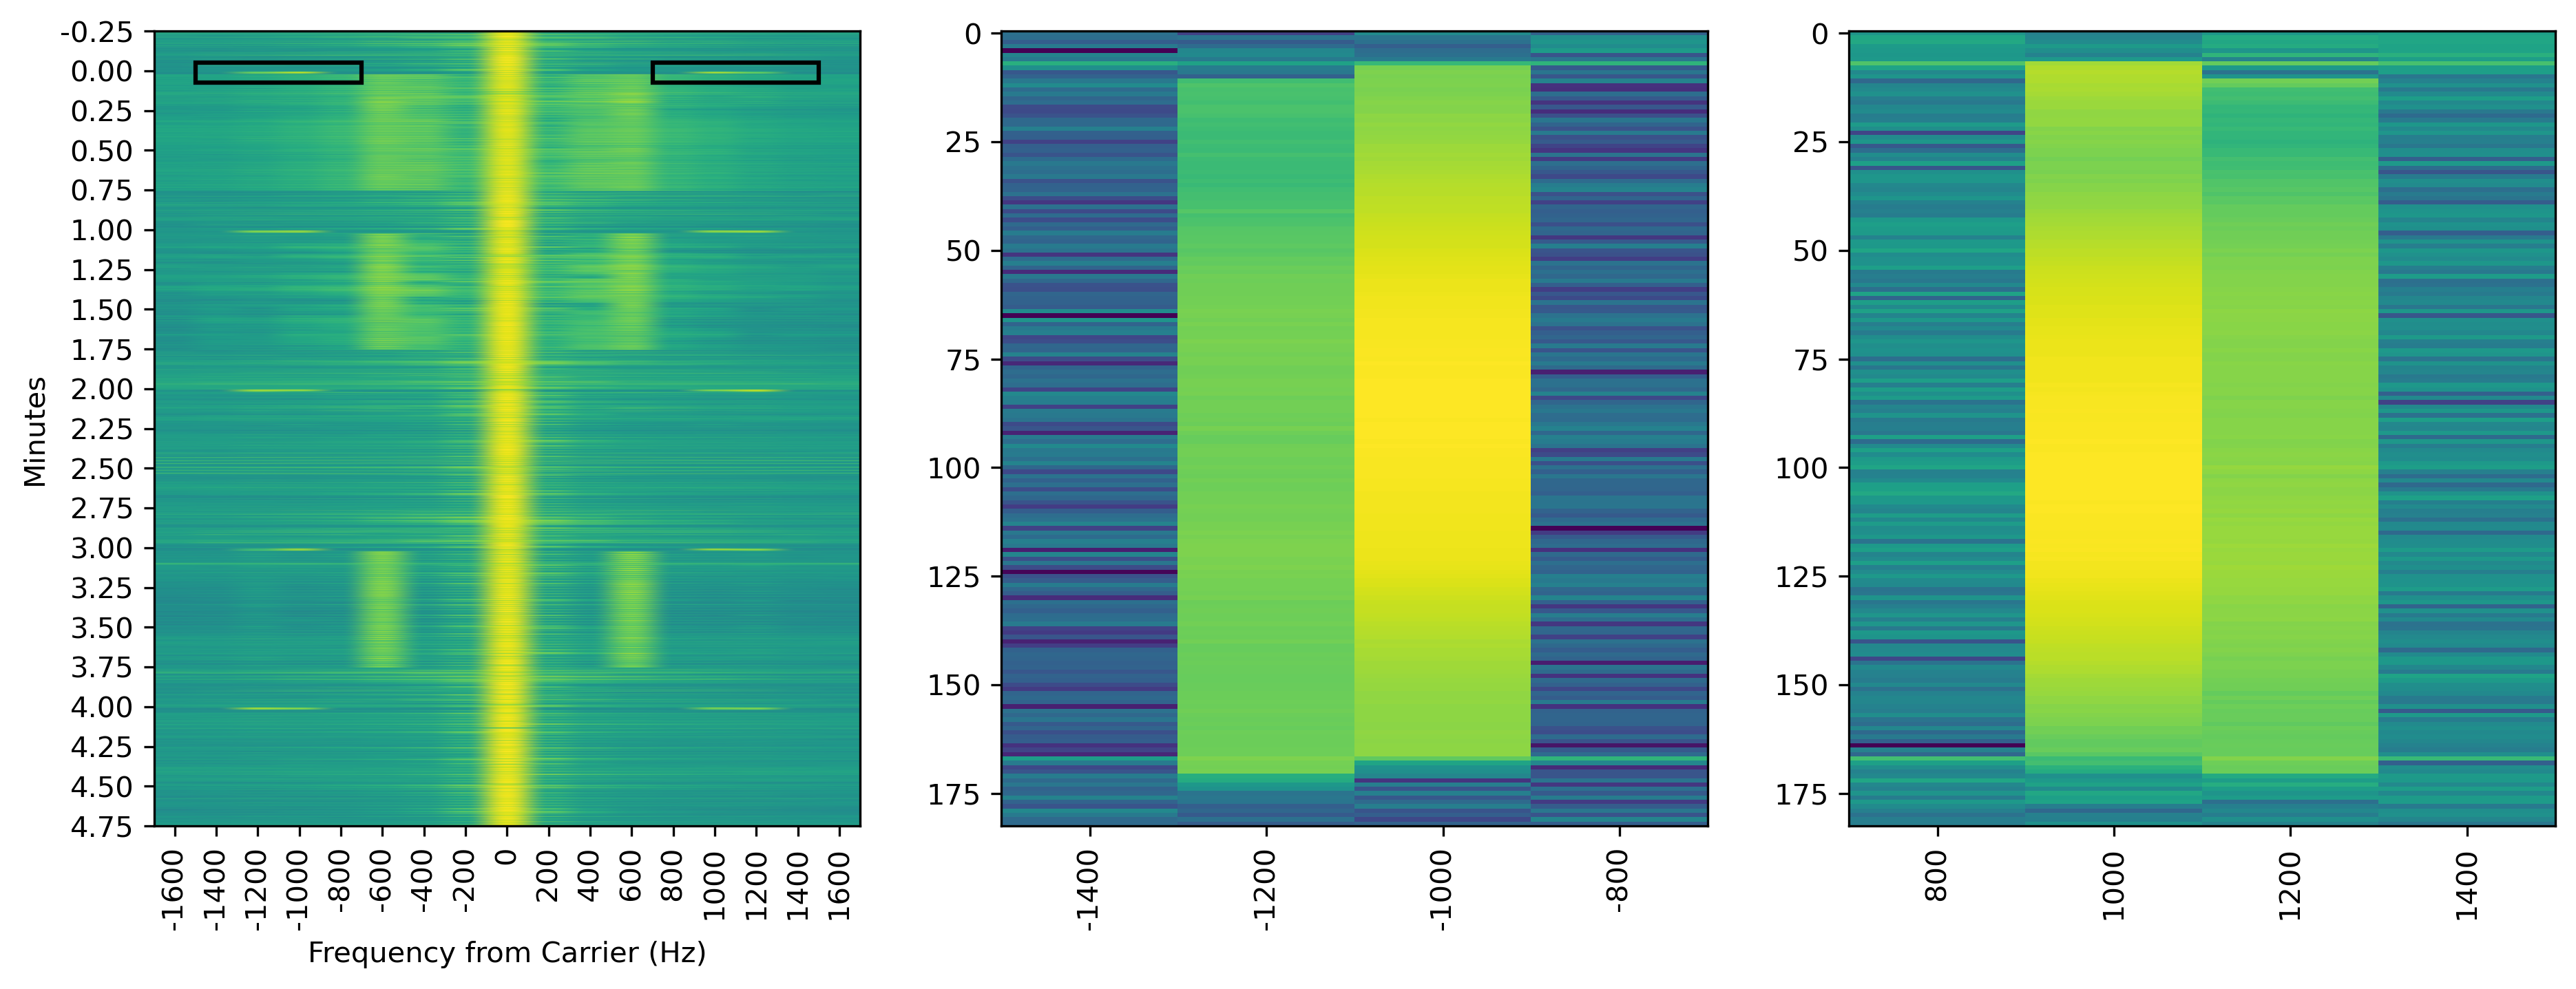
Several features jump out:
- The carrier sits at 0 Hz offset (centre of the plot) and runs continuously.
- Horizontal striations at 1, 2, 3, and 4 minutes are the start-of-minute markers — exactly where the 800 ms pulses live in time.
- Away from the carrier, energy clusters around ±1000 Hz and ±1200 Hz. Those are the BCD time-code subcarriers; WWV and WWVH use the same structure on 15 MHz.
- The two zoomed panels (black boxes in the overview) isolate the +700 to +1300 Hz and −1300 to −700 Hz sideband blocks for a closer look at how the tones turn on and off through the five-minute window.
This view confirms we captured clean minute boundaries and enough sideband structure to align traces in the time domain.
Stacking pulses at the start of each minute
The next step is to cut a short window around every minute rollover and average (or accumulate) those slices so the repeating 800 ms structure stands up above the noise. Conceptually: find eight minute starts in the file, extract ~200 ms of envelope around each pulse, and overlay them.
(An interactive spectrum widget from the original pblog notebook has not been migrated yet; the static figures below carry the same analysis.)
Modeling the 800 ms envelope
WWV/WWVH do not switch instantaneously. The pulse rises and falls over a few milliseconds, and the recorded trace is noisy. Rather than a hard rectangular gate, I model the envelope as the sum of two logistic (sigmoid) curves — one for the rising edge, one for the falling edge:
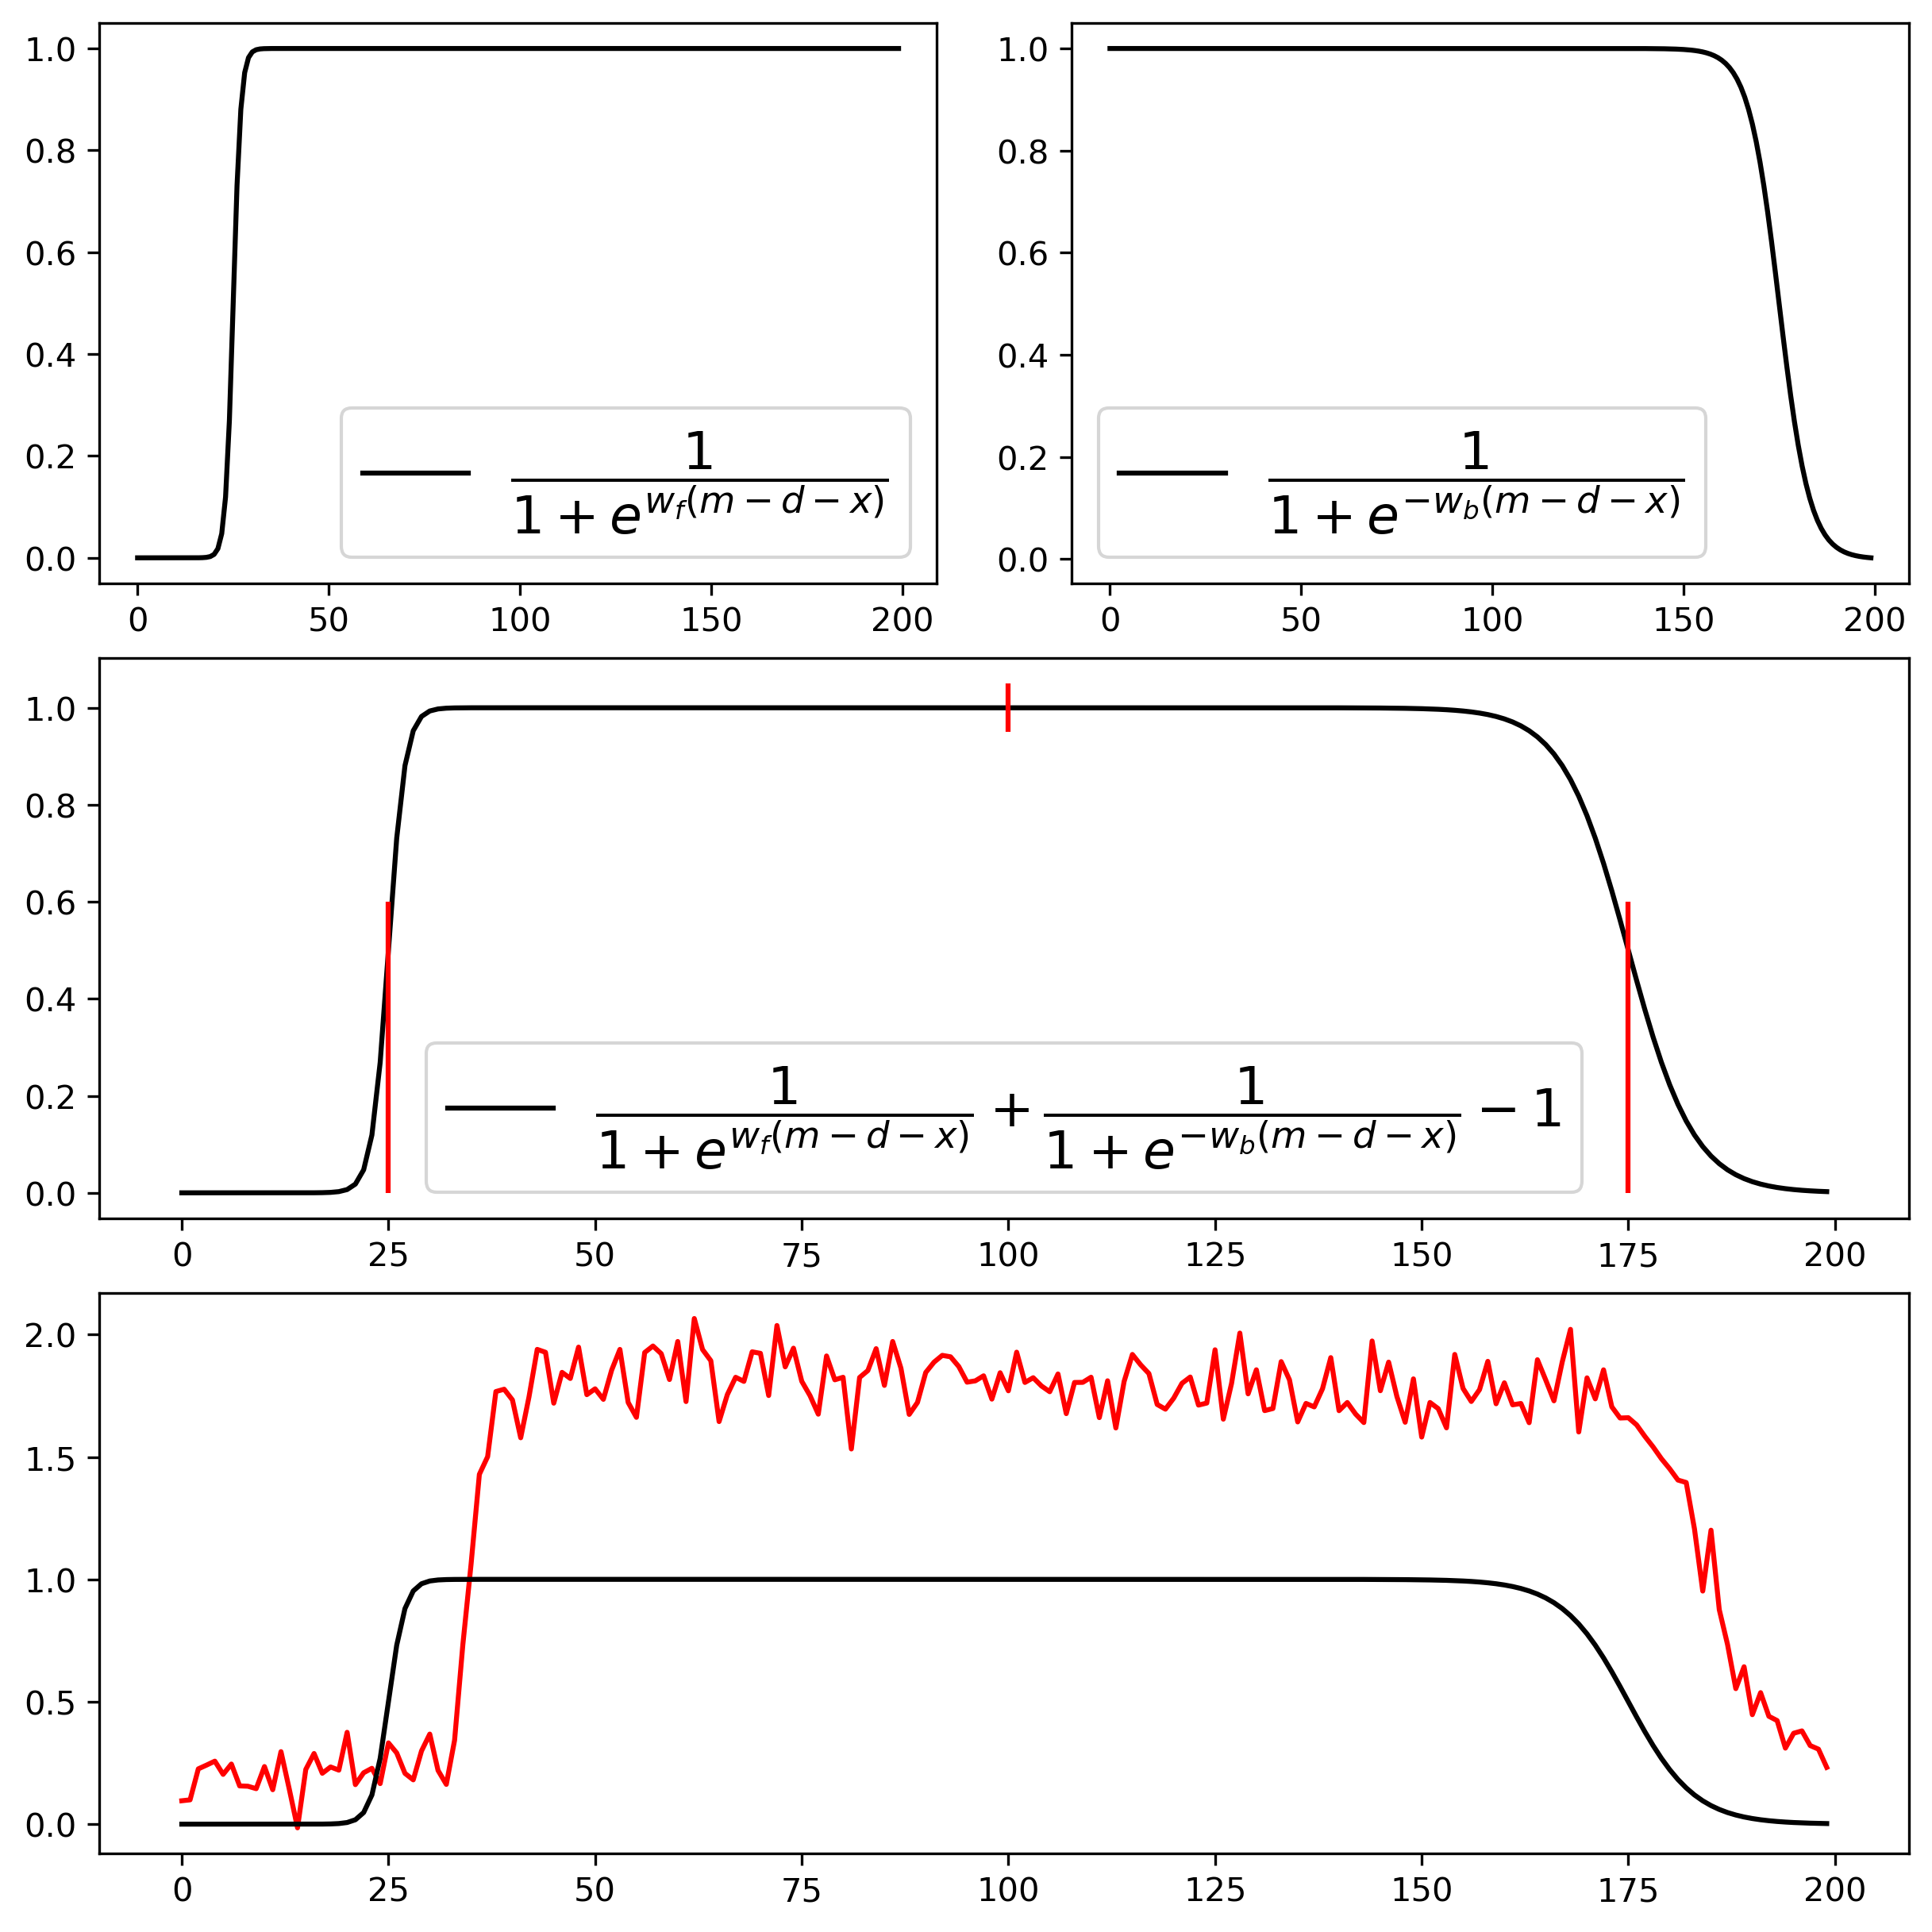
The top panels show each edge in isolation. The middle panel combines them into a smooth plateau roughly 150 ms wide (red tick marks at ~25 ms and ~175 ms on a 0–200 ms axis). The bottom panel compares that ideal shape to a real averaged trace: same timing, but the data sit on a noisy baseline and the plateau amplitude varies — especially for the weaker station.
A single raw averaged slice (before fitting) looks like this:
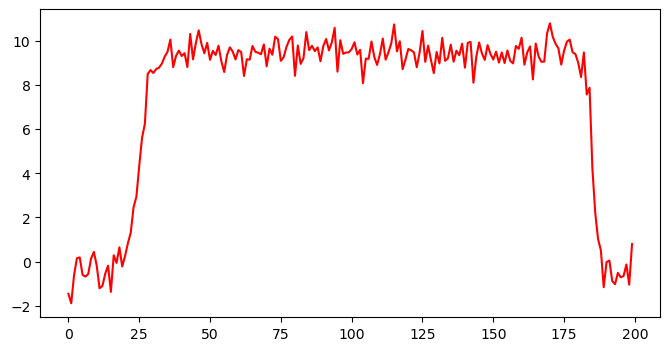
The pulse is unmistakable even without fitting: quiet baseline, step up, ~160 ms of high level, step down. The fit is there to measure the edge positions and separate WWV from WWVH when both appear in the same stack.
Fitting: Bayesian inference on pulse timing
With eight minute-start slices in hand, the data array has shape (8, 200) — eight pulses, 200 time bins per pulse:
(8, 200)
A PyMC model treats each trace as a scaled, shifted copy of the logistic envelope plus Gaussian noise. Key unknowns include:
wwv_m_ms/wwvh_m_ms— centre time (ms) of each station's pulse within the windowdelay_ms— separation between WWV and WWVH centroidsw_f,w_b— steepness of the rising and falling logistic edgeswwv_A,wwvh_A,sigma— amplitude and noise scale (allowed to vary per slice when WWVH fades)
Posterior summaries from the sampler:
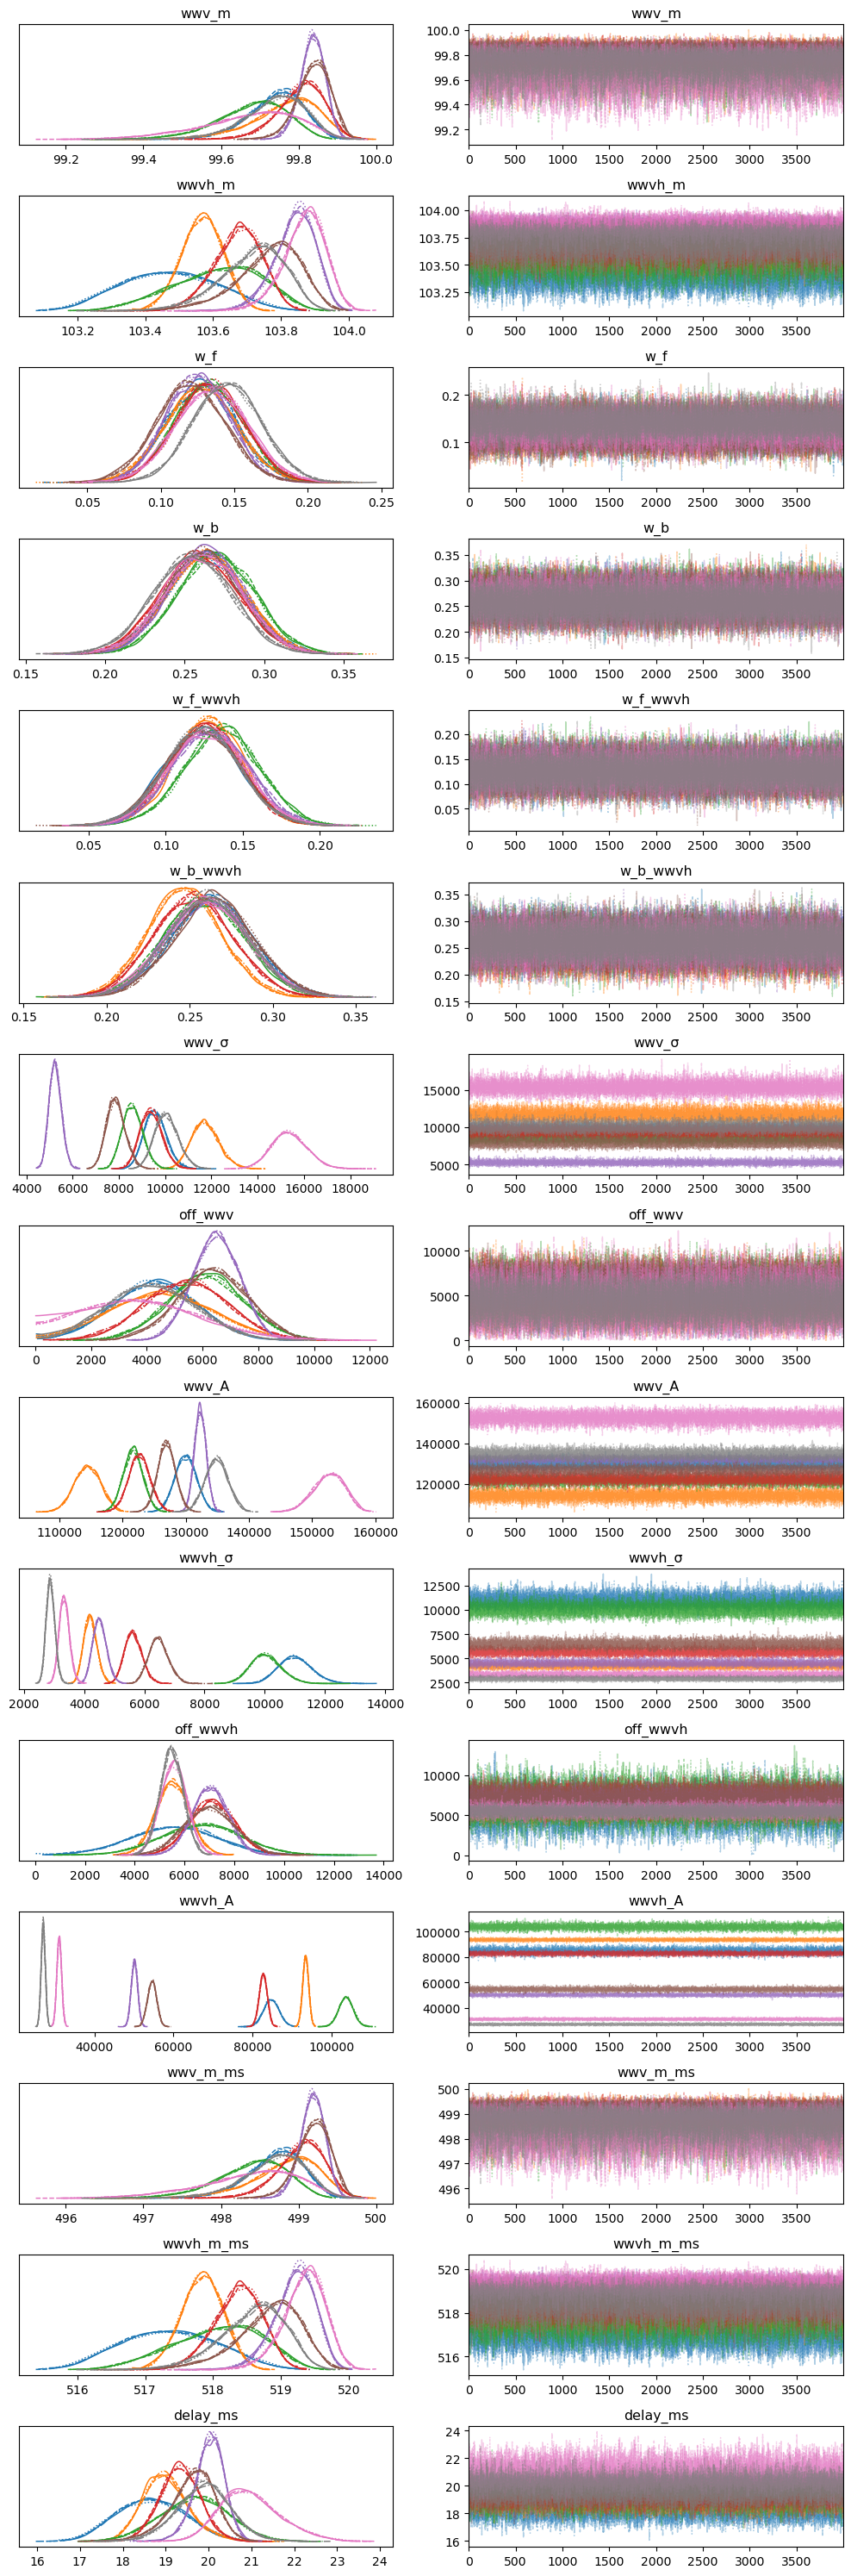
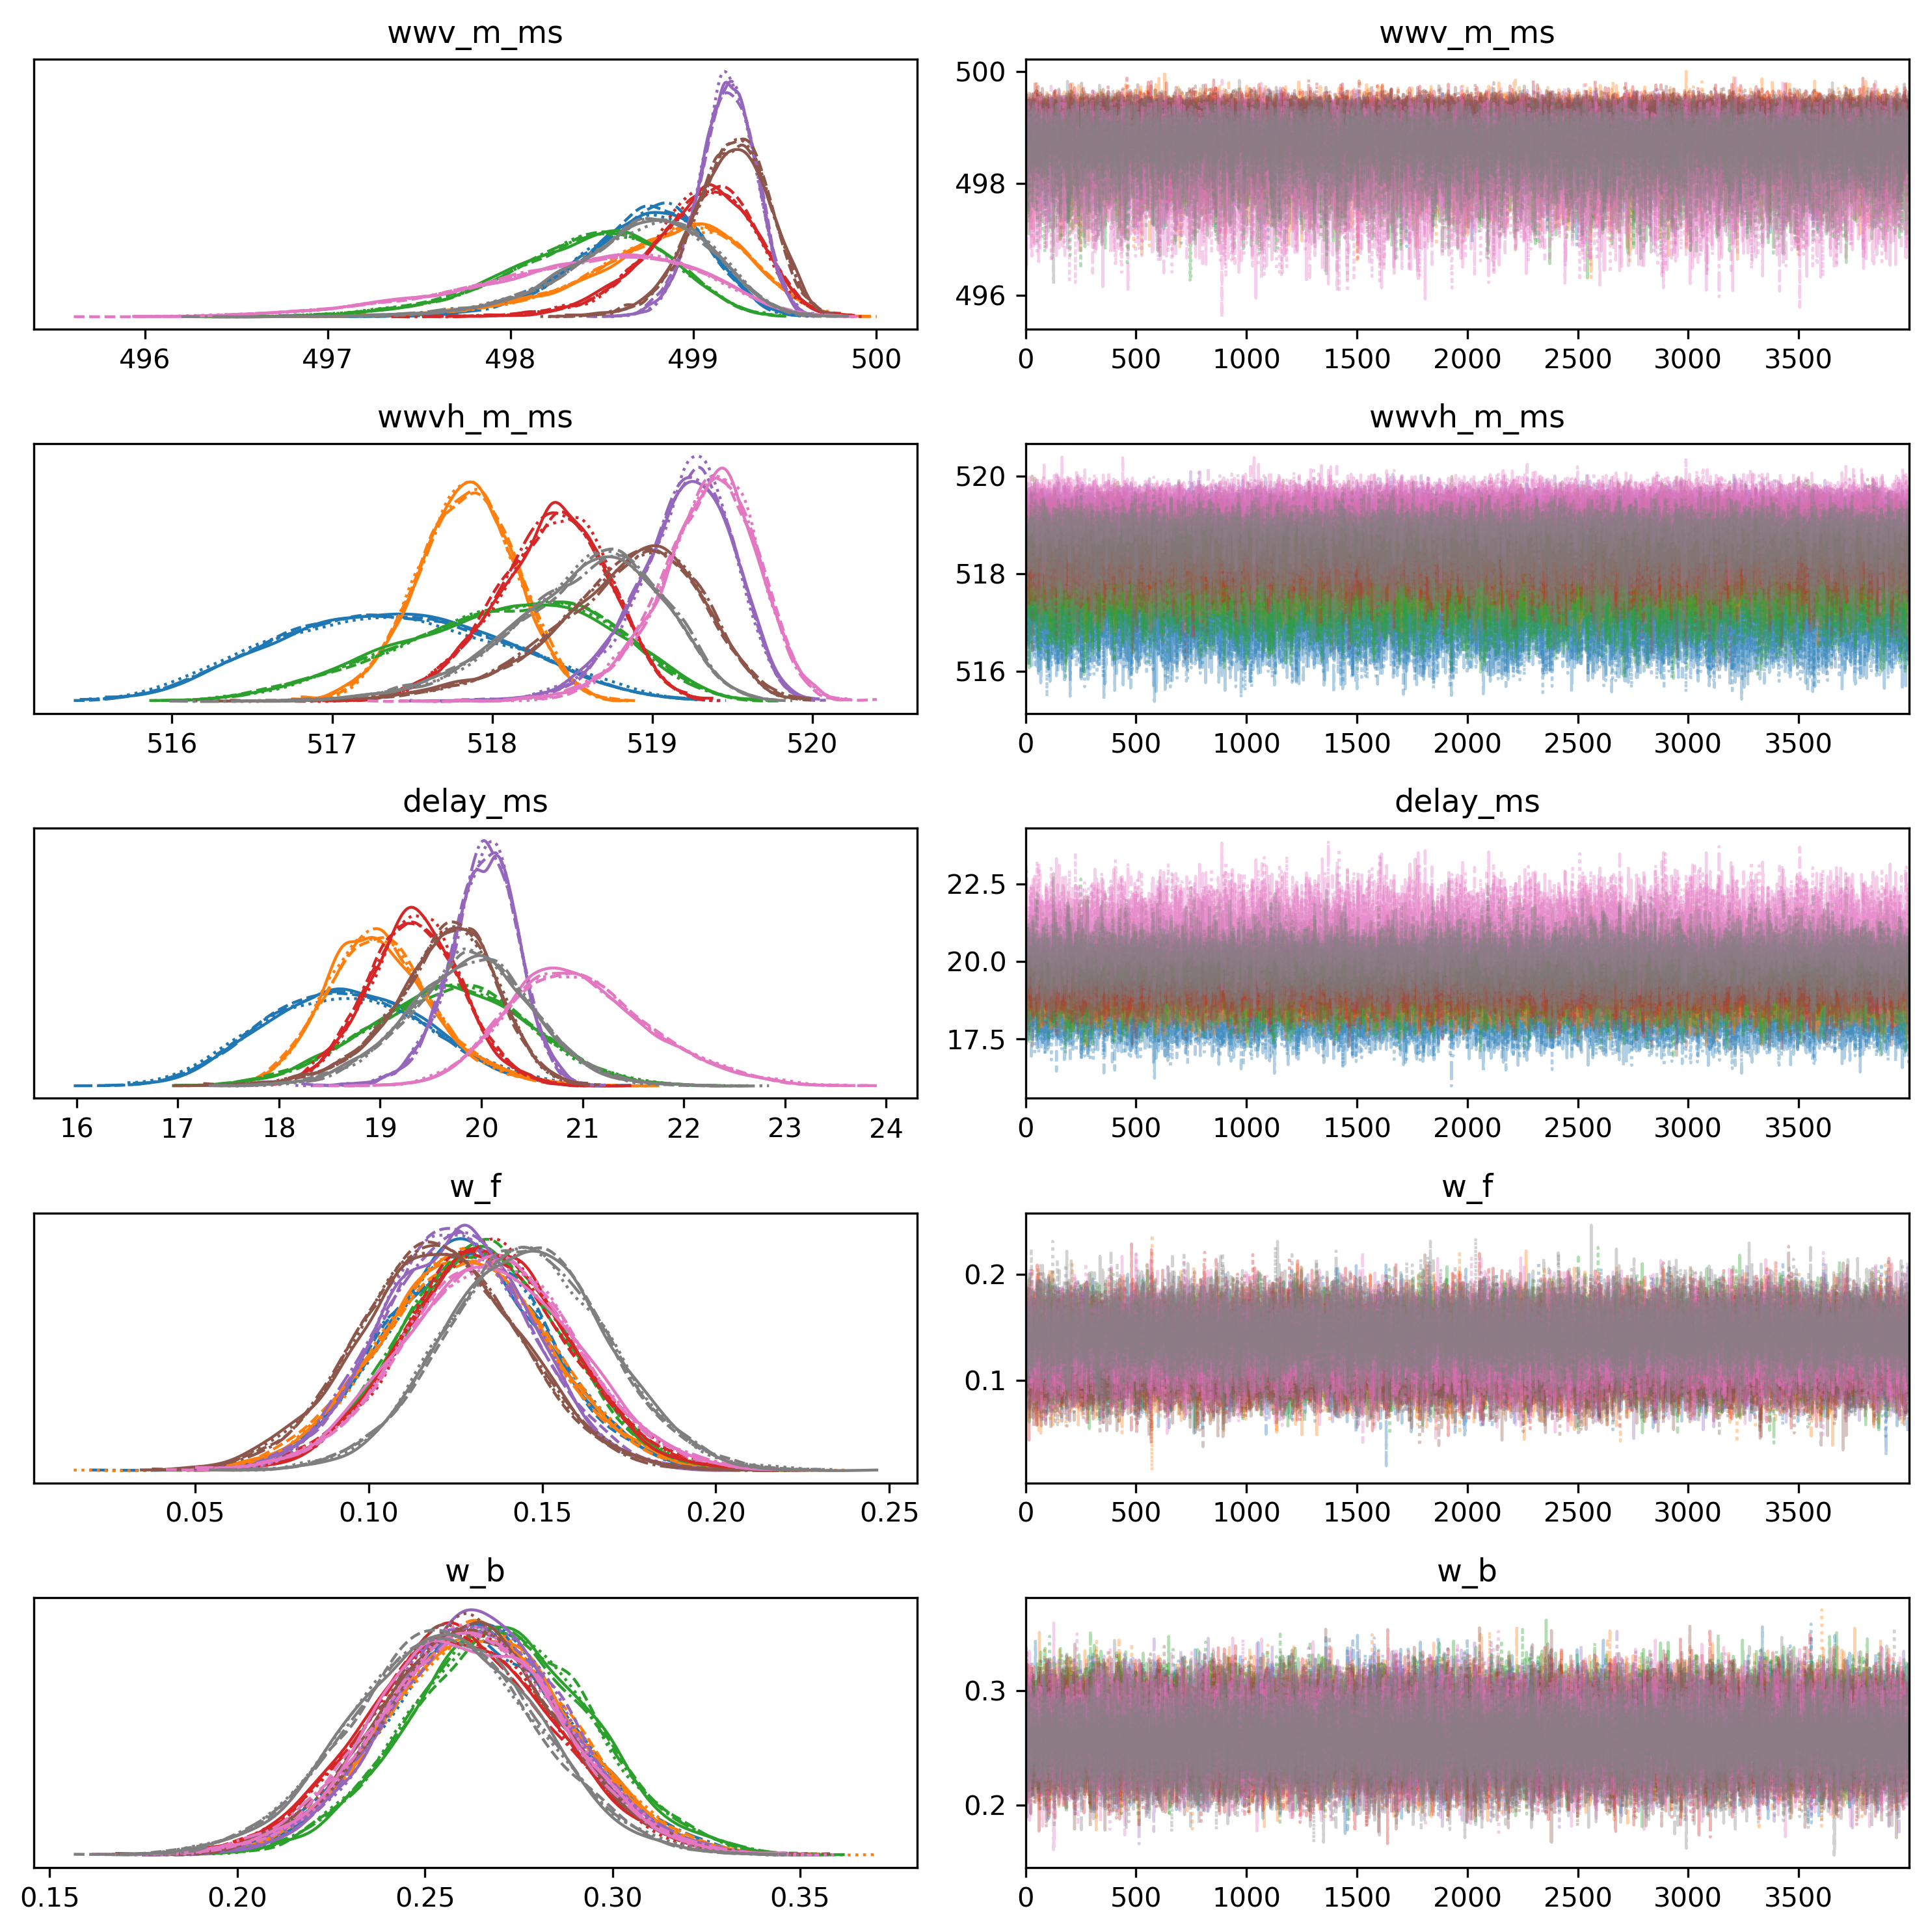
The trace plots ("fuzzy caterpillars") indicate the chains mixed well. delay_ms concentrates around 19–21 ms, matching the known Colorado-vs-Hawaii path difference at HF. wwv_m_ms sits near 499 ms and wwvh_m_ms near 518–519 ms — about 19 ms later, as expected.
A reduced model focusing on the timing parameters alone:
Point estimates extracted from the fit (one value per stacked minute):
[18.66503136 19.01079225 19.67016744 19.33521841 20.01496352 19.60958308
 20.97870987 19.88572992]
[0.79124762 0.54791341 0.79155523 0.4705195  0.34865943 0.53787142
 0.70727115 0.63355319]
The first row is delay_ms per slice — mostly 18.7–21.0 ms, consistent with the posterior in Figure 5. The second row is related edge-weight / steepness estimates (w_f-like) that vary slice-to-slice as WWVH weakens.
Centroid times in milliseconds for each of the eight stacked minutes:
array([498.69768125, 498.82687994, 498.39402808, 499.02650424,
       499.18136159, 499.19634433, 498.36120488, 498.68941852])
array([517.36271261, 517.83767218, 518.06419551, 518.36172265,
       519.19632512, 518.80592742, 519.33991474, 518.57514844])
The first array is WWV — tightly clustered near 499 ms. The second is WWVH — centred near 518 ms, roughly 19 ms later. That offset is the measurable signature of receiving both stations on the same frequency at the same time.
Other printed values from the notebook:
array(0.13082639)
array(0.02443936)
These are summary spreads (posterior standard deviations or similar) for the edge-weight parameters — small values mean the logistic steepness was pinned down reasonably well.
array([ 0.,  4.,  8., 12., 16., 20., 24., 28., 32., 36.])
numpy.ndarray
Minute indices (or offsets in minutes) used when slicing the long recording — the eight pulses come from the first ~36 minutes of usable data in the file (not every minute in that span necessarily passed quality cuts).
Per-slice fits: WWV steady, WWVH fading
Overlaying the model on each of the eight stacked traces tells the physical story most clearly:
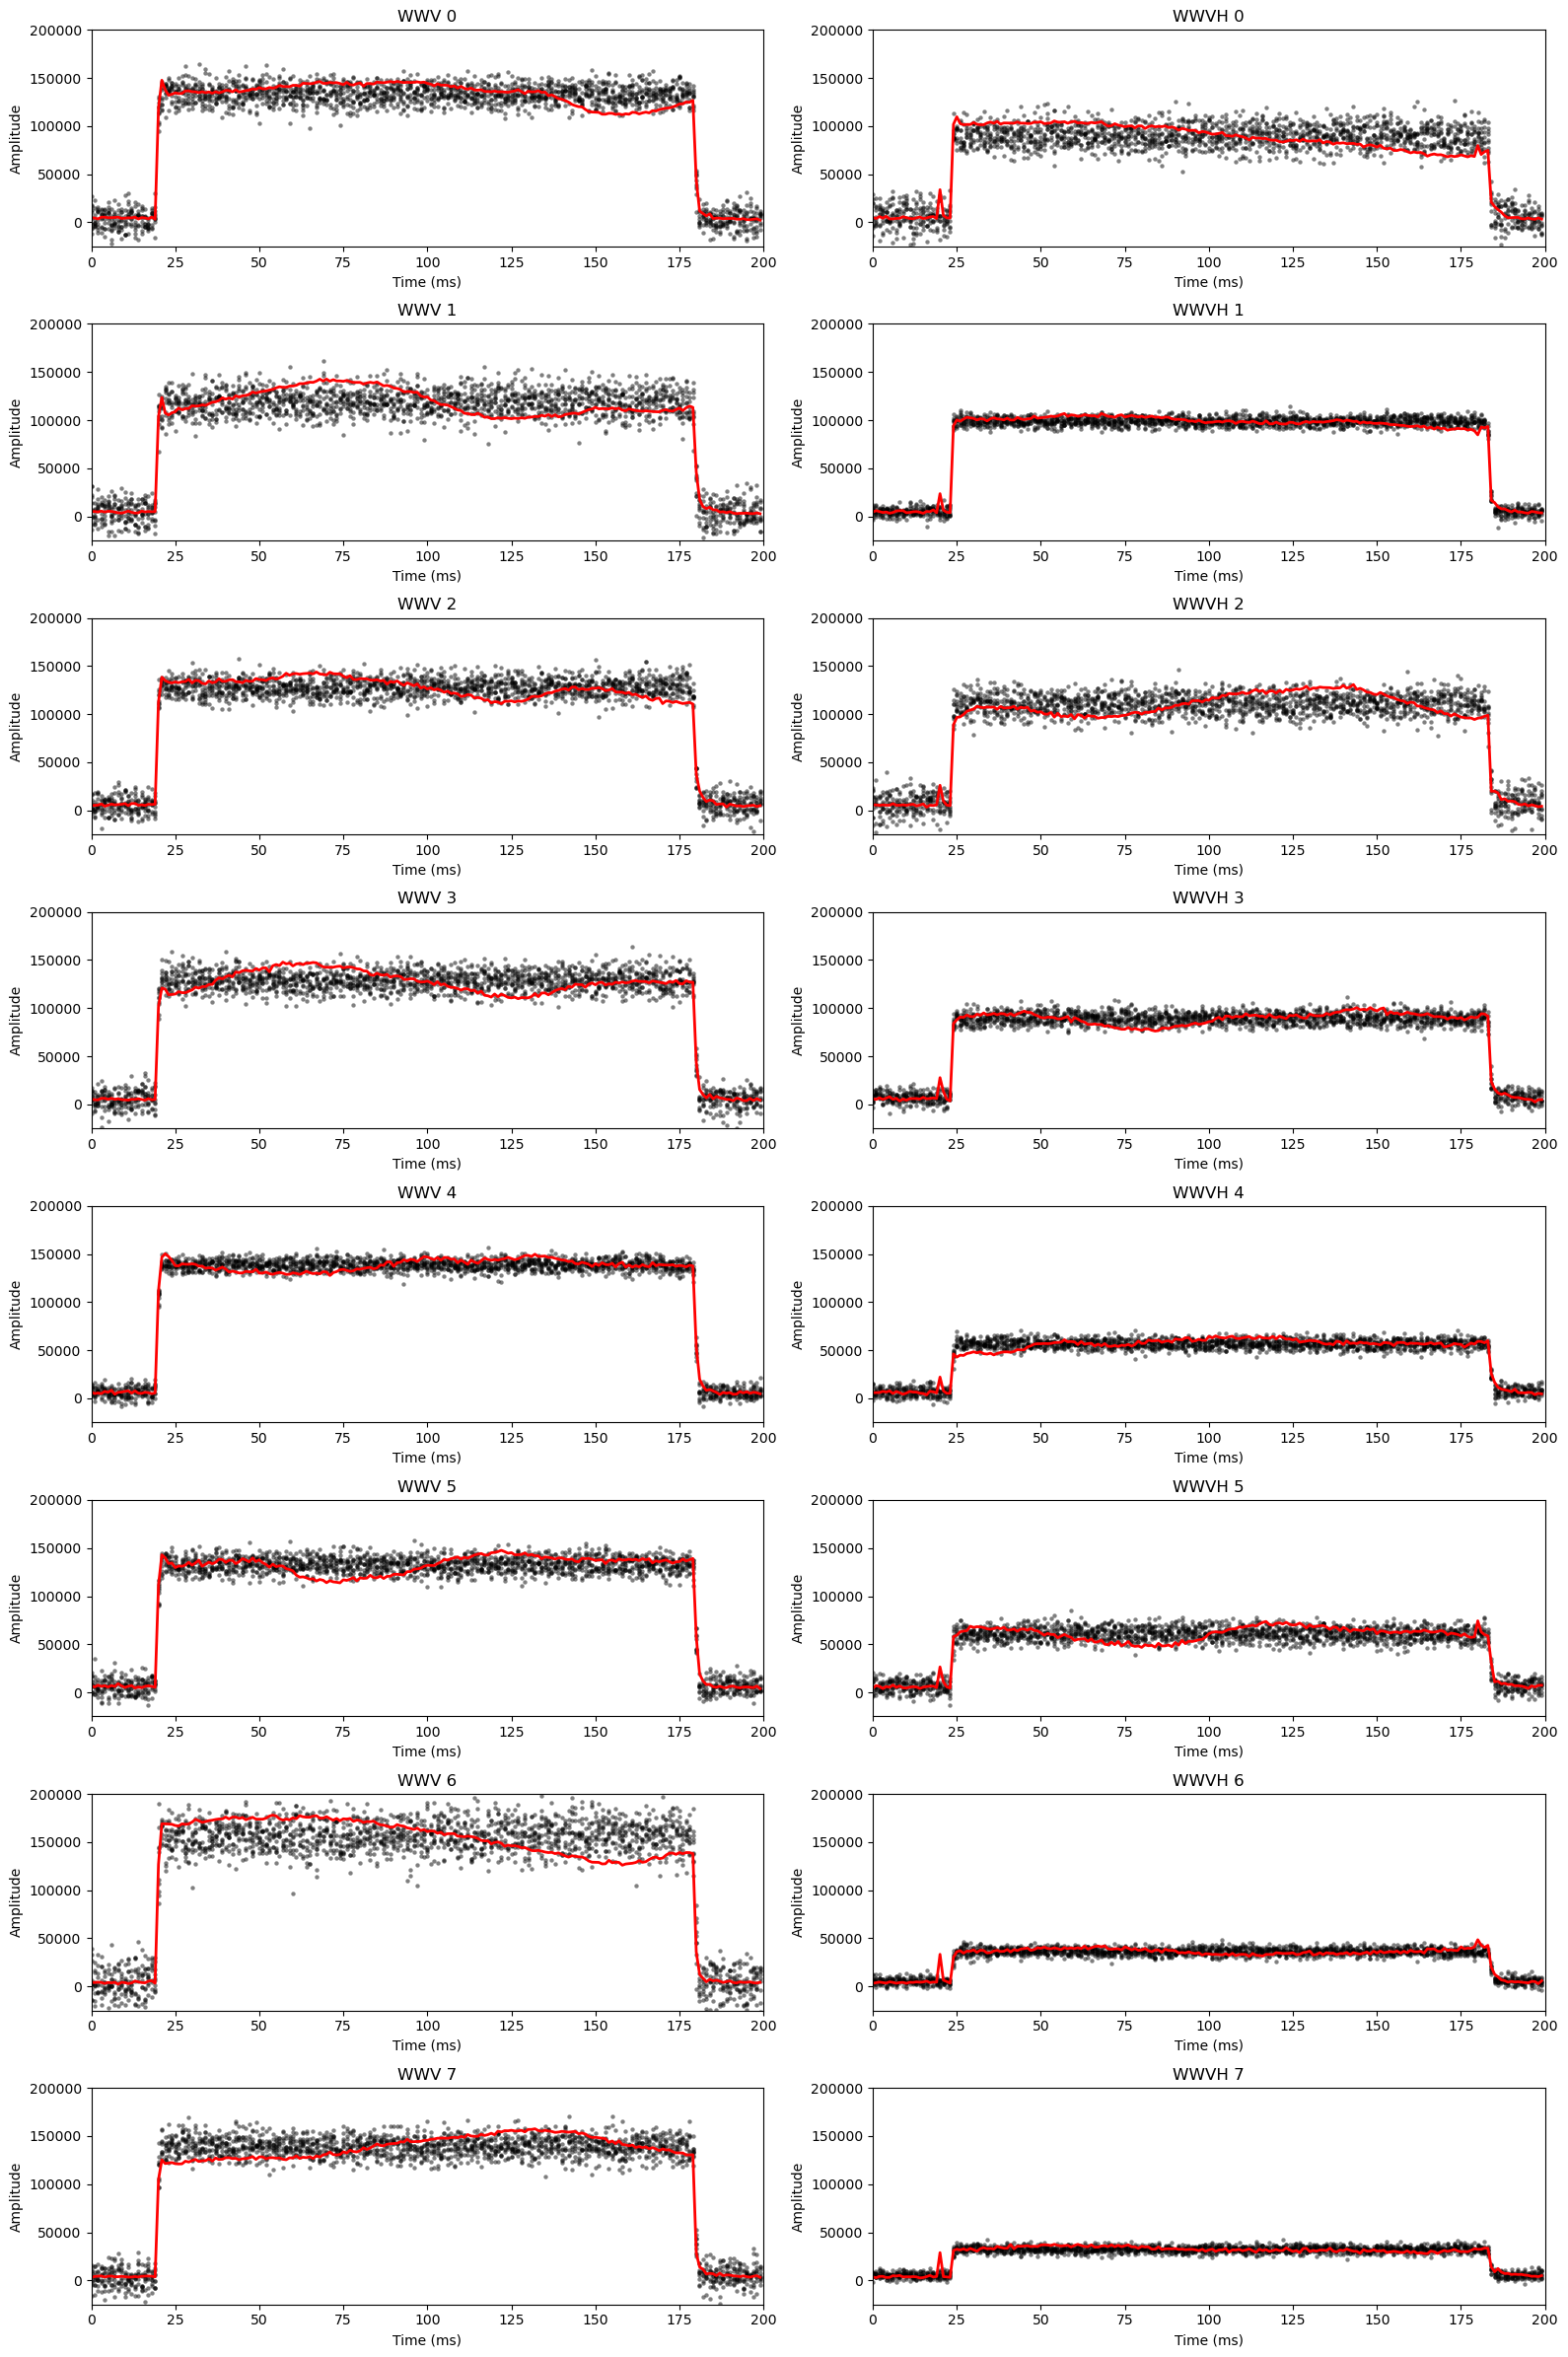
- WWV (left column): amplitude stays high and stable across all eight minutes — the Fort Collins path was solid throughout the recording.
- WWVH (right column): the same pulse shape, but the plateau shrinks from top to bottom. By slices 6–7 the Hawaii signal is only ~35–40% of its initial strength — classic HF fading on the longer path.
- The fitted red curve tracks both stations even as WWVH drops into the noise, which is why the model allows per-slice amplitude and sigma rather than forcing one global level.
What this buys you
None of this replaces a cesium clock, but it is a satisfying sanity check on HF propagation:
- Dual pulses are real and measurable — ~19 ms separation on 15 MHz matches geometry plus ionospheric path.
- Stacking minute markers works — you can pull timing information out of noisy amateur-band recordings with a smooth envelope instead of brittle edge picking.
- Fading is visible in the fit — WWV and WWVH share a frequency but not the same path; watching WWVH die while WWV stays up is exactly what you'd expect from two skip distances on the same band.
There is more to do — migrate the interactive spectrum widget, document the IQ capture settings, and tighten the prose around the PyMC model specification — but the figures and numbers above are the core result: two time-standard pulses, one delay, and a fade you can see in the data.