An RSA SecureID Dongle Story
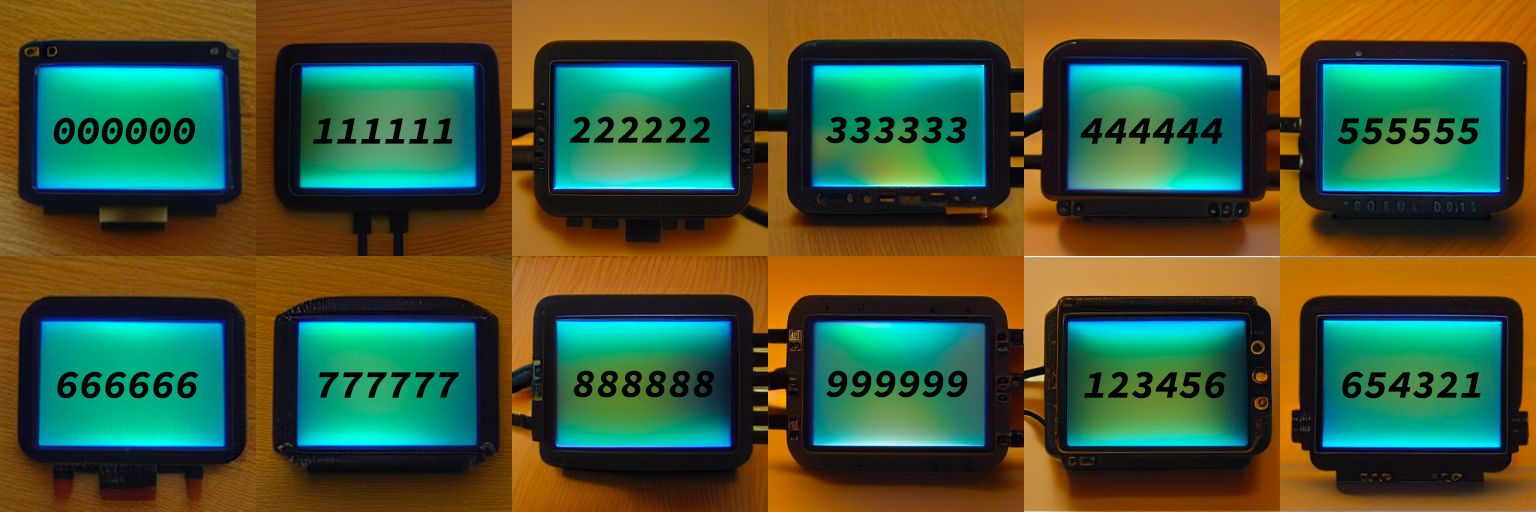
The aesthetics behind interesting numbers is fairly subjective. In a famous story relayed by the British mathematician G. H. Hardy, Hardy mentioned to his colleague (the even more famous) Srinivasa Ramanujan that the number 1729 was boring. Not to Ramanujan of course, who quickly retorted that 1729 was the smallest number expressible as the sum of two cubes in two different ways. So, for some it would seem every number is interesting. The rest of us mere mortals, interesting numbers usually involve patterns directly in the sequence of digitals that make up a number. For example, if I randomly selected the number ‘111111’ out of a hat that had all the numbers from 0 to 999999 in it (one million in total — must be a big hat) most people would be prepared to say, ‘well that's an interesting number!’. You might even take a photo to capture this amazing moment and happen to mention it to some friends.
Something similar just happened to a friend of mine. Of course he didn’t create one million pieces of paper with the numbers 0 to 999999 written on them and stuffed them into a hat. Instead, he noted that the number ‘111111’ came up on his RSA SecureID dongle which he uses as a 2FA device to verify his identity, took a photo and shared it with me. Note, I can’t share the photo because of some security concern — fair enough. This device produces a new number between 000000 and 999999 every 60 seconds in such a way that that number can be cross checked as ID linked to my friend, so it is not a ‘random number’ per se, but for all intents and purposes it seems that the numbers generated fit the profile of a random number between 0 and 999999 every 60 seconds. At least for this exercise we will assume so.
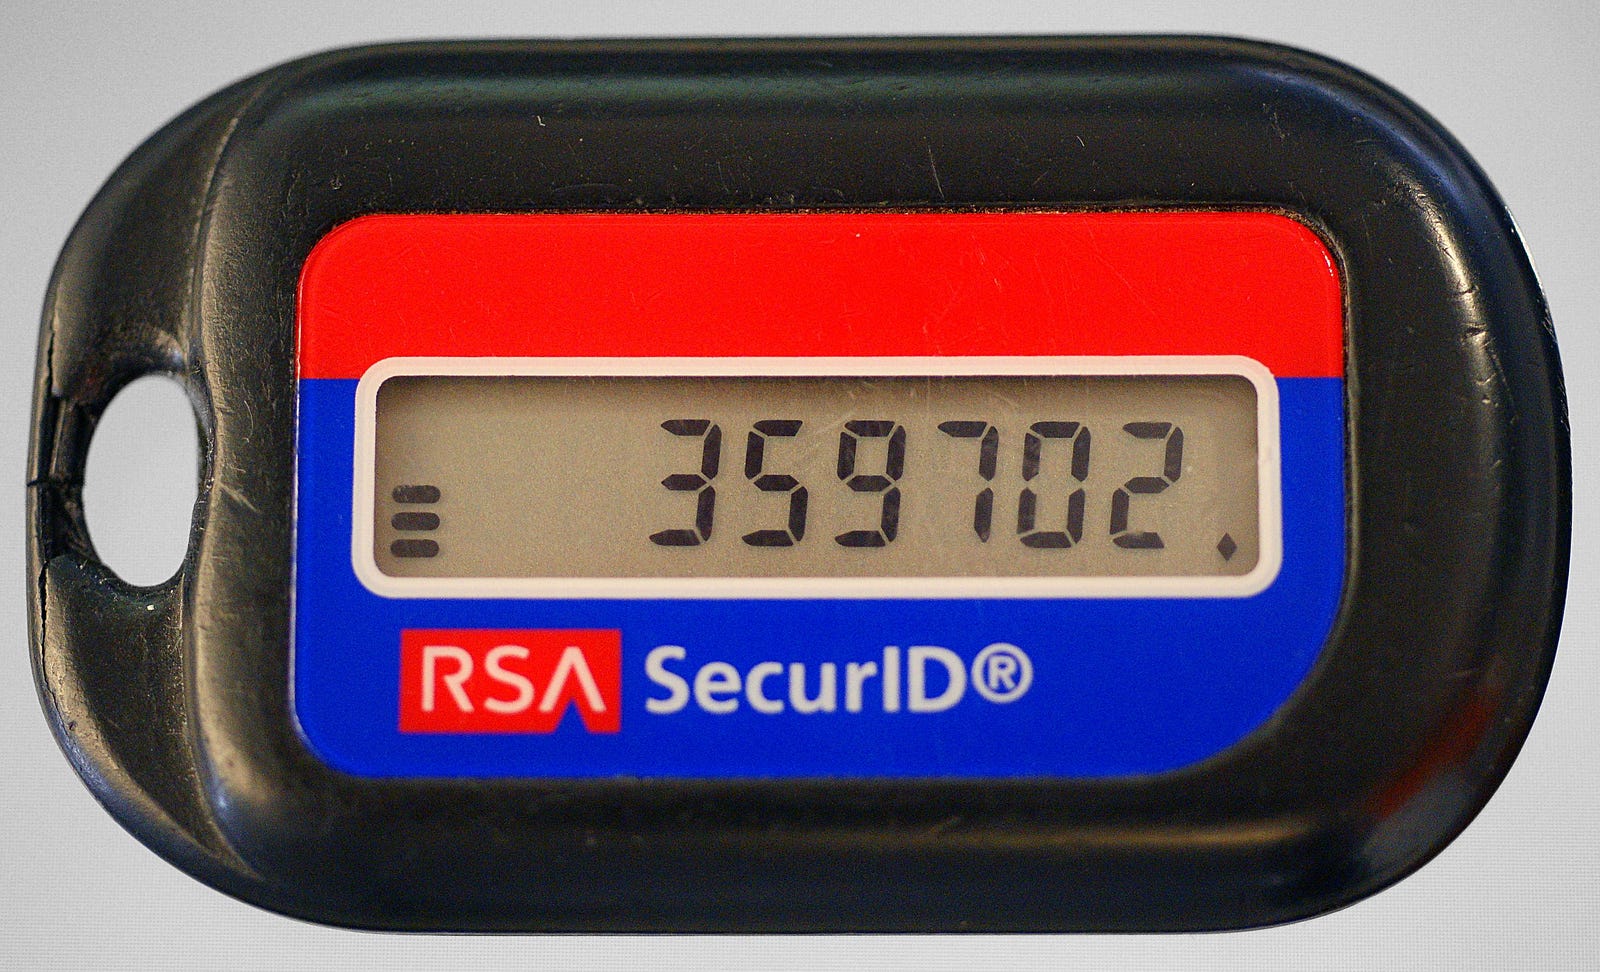
My friend followed up with, ‘(the probability of) me actually looking at my dongle when it did this are absurdly low’, and then continued with, ‘factor in the chances of me LOOKING at it during the 60 second window it appeared generally I will only look at the dongle maybe 6–10 times a day’. Well, I am the probability nerd in my group of friends so that got me thinking… Is it really absurdly low? Let’s find out if he is correct.
To start we will gather all the relevant information. After inquires where made and some laughter at my expense, we have the following information that defines the problem:
How many numbers have been seen?
First lets figure out how many numbers ‘Lager’ has probably seen while using this device:
period_of_number_generation = 60 # seconds
period_of_observation = 15 # seconds
Because the period of observation is not infinitely small, there is a chance that two numbers might be seen. ‘Lager’ suggested that when he looks at the dongle he does so for about 15 seconds on average. So the number of numbers he will see on the dongle with each observation is actually:
numbers_seen_per_observation = 2*(15/60) + 1*(60-15)/60 # 1.25‘Lager’ has had the dongle for about 5 years. He claims to look at it about 8 times a day. I didn’t ask if that included weekends so we will (badly) assume that it does. How many observations is that? Easy:
num_observations = 8 * 5 * 365 # 14600And therefore the total number of observed numbers is estimated at:
total_observed_numbers = 14600 * 1.25 # 18250Interesting Numbers
Now let’s turn to what is an ‘interesting’ number. For the numbers between 0 and 999999 we will define interesting numbers as the numbers in the set
interesting_set = (000000, 111111, 222222, 333333, 444444, 555555, 666666, 777777, 888888, 999999, 123456, 654321)Is this somewhat debatable and arbitrary? Of course it is. Define your own set and follow along if you must. Now, the number of numbers in this set is 12. So to be clear I am making the claim that out of one million numbers, 12 are interesting. It actually isn’t important which 12 are ‘interesting’, what matters is how many of them there are. Someone might claim that 111111 is not interesting while 359702 is interesting. That is weird, but fine. They would put 359702 in their set and maybe leave 111111 out. In the end, all that matters is the cardinality of the set. That is, how many unique numbers are in it. It’s important to note this. The ‘answer’ to the chances of an interesting number is quite subjective and depends entirely on how you define ‘interesting’. To Ramanujan, they are probably all interesting. So us here, we will stick with the set above:
num_interesting = len(interesting_set) # 12 - cardinality of the setBecause there are 1000000 possible numbers (the numbers between 0 and 999999, inclusive, amount to 1000000), every time we look at the dongle there is a num_interesting/1000000 or 12/1000000 chance of seeing an interesting one.
p_interesting_observation = num_interesting / total_numbers
# (12/1000000)
This is quite low. But we are not interested in the chances of seeing an interesting number whenever we look at the dongle, we want to know what is the chance we will see at least one after regularly looking at the dongle over a 5 year period; an estimated 18250 times.
‘Eventually’ is Not Guaranteed.
There tends to be a simple heuristic in the human mind to think you can add these probabilities up with repeated trials. That is, if winning the lottery is a one in a million chance all you need to do is play the lottery a million times and you have to eventually win. Not true! It’s easy to convince yourself its not true by considering the simple coin flip experiment where the probability of getting heads is p=0.5. Is it guaranteed you will get at least one heads after two (0.5 + 0.5 = 1) flips? Of course not. The counter situation is getting 2 tails (0 heads), with probability 0.5 * 0.5 = 0.25. So the chances of at least one heads? 1–0.25 or 0.75; quite different from certain.
We can calculate and plot the probability for all potential outcomes in a situation like this. There are three options, 0 heads, 1 head or 2 heads. It can’t be less than 0 since we negative counts don’t make sense, and it can’t be more than 2 since we only flip twice. Such a probability plot is below:
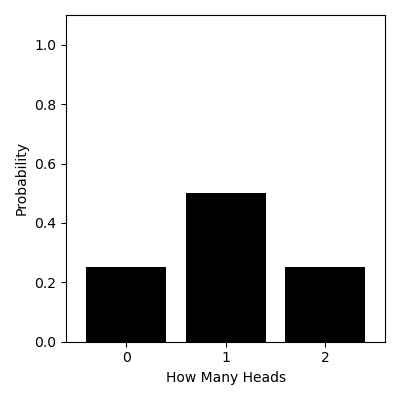
So when the probability of getting a heads is 0.5 and we flip two (2) times, sure the most likely outcome is 1 heads (0.5 * 2), but other things are possible, including the possibility of getting no heads (0) at all, with a probability of 0.25.
When Things Either Happen Or They Don’t
The example above is an example of the Binomial Distribution. Basically, the binomial distribution tells us the probability of getting k specific outcomes, like getting a head from a coin flip, from n total outcomes like coin flips, when the probability of a specific outcome, like getting a head, is p.
The equation for it looks like this:

It is called the binomial distribution because we only consider two possible things happening. It either does with chance p, or it doesn’t with chance q which is 1-p.
So returning to our RSA Dongle example, lets ask whats the chances of seeing ‘k’ interesting numbers, with a probability of seeing an interesting number being 12/1000000, if we look at the dongle 1000000 times. Is the most likely outcome 12? Yes it is. But so is 11. See below:
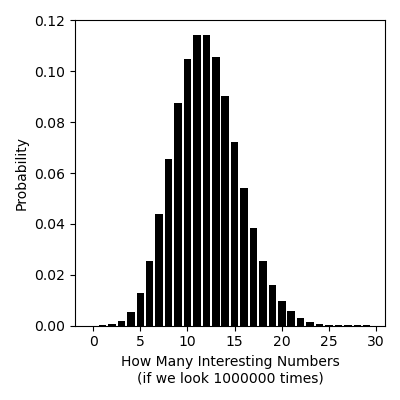
The probability of seeing 12 interesting numbers is 0.114 or 11.4% of the time. This might be the most likely outcome, along with 11 interesting numbers, but it is also a minority of the expected outcomes. We actually expect to see not 12 interesting numbers with a probability of 1–0.114. To restate, we would expect to see something other than 12 interesting numbers with a probability of 0.886, which is quite high.
Lets Answer Our Initial Question
Recall we estimated that my friend would have looked at the dongle about 18250 times in the past 5 years. So we are not looking at it a million times, but only 18250 times. How does this change things? Using this new information, we either see a interesting number, (p=12/1000000), or we don’t (q=999988/1000000), and we see k of them after looking at it (n=18250) times, where k can be any number between 0 and 18250. Lets put all that into the binomial distribution equation with values of k (the number of specific outcomes — in our case the number of times we get an interesting numbers).
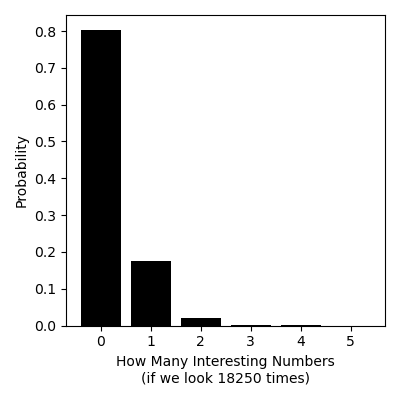
The mostly likely outcome is 0 (k=0) interesting numbers with a probability of 0.803. So my friend really should have not expected to see an interesting number in the five years of using the dongle. On the other hand, he suggested the chance of seeing his specific example of one interesting number was ‘absurdly low’. Well not really. The chances of seeing an interesting number (k=1) is 0.176 or about 18%. That’s is not too low at all. If we ask the broader question, what is the chances of seeing at least one interesting number, meaning we allow for seeing 2 or 3 or 4…. all the way to 18250 (each time we see an interesting number!) we can easily calculate it as the converse of seeing 0 interesting numbers. That is 1–0.803 or 0.197 or almost 20%. That is not very remote at all.
Lets change things around a little and say that only ‘111111’ is an interesting number. How does this change things? Well now p=1/1000000, q=999999/1000000 and n is still 18250. The chances of seeing 0 examples of ‘111111’ over 18250 observations is now about 0.98, which of course means the chances of seeing at least 1 example and maybe more is 1=0.98 or about a 2% chance. Not absurdly low. Now, in defense of my friend I also thought initially the chances would be very low but I also was skeptical enough to doubt it.
Putting aside whether the chances are absurdly low or not, what is the actual right answer? Should my friend have expected to see an interesting number 2% or almost 20% of the time?
The Answer Is So Often Subjective
Richard Feynman is often quoted as once saying to his class,
“You know, the most amazing thing happened to me tonight… I saw a car with the license plate ARW 357. Can you imagine? Of all the millions of license plates in the state, what was the chance that I would see that particular one tonight? Amazing!”
Is it amazing? Feynman was making the point that we can sit down and do the maths and conclude that the chances of a random number plate being ‘ARW 357’ is low (1/(26*26*26*10*10*10) = 0.000000057. But that is not the scenario brought into the class. Feynman nominated a specific plate, but why? Because he had seen it. This changes everything for him and because he told the class about it, it changes everything for everyone in the class too. The chances that that plate was on a car on the way to class is precisely 1.0 — certain, because he has already seen it. Questions of probability are often like this. The context matters greatly, and the context can depend on a point of view. That is, it can be genuinely subjective. Reasonable people can disagree. If Richard Feynman had asked ‘whats the chance that the first car you next see has the plate ‘ARW 357’’ and Richard had not seen that plate himself recently, the best guess would be about 0.000000057. If he had seen the plate, but didn’t tell you, then his chances of seeing it would be very much higher than it would be to you without this information. Neither person is wrong.
The same applies with our analysis above when it comes to interesting numbers. What makes for an interesting number? I identified 12 between 000000 and 999999. Ramanujan would find more. Someone else, maybe less. So our answers would be different.
None of us would necessarily be wrong in our final result. What really matters is that we state our assumptions clearly and transparently. Then we ask, can they be justified and critiqued? If so, only then does rigorous and correct analysis under the given data and assumptions matter.
The Code:
Below I have pasted the code I used to generate the numerical results in case you wish to reproduce/tinker/etc.
obs_window = 15
reset_window = 60
overlap_ratio = obs_window/reset_window
average_obs =(1-overlap_ratio) + 2*overlap_ratio
print(f'average_obs = {average_obs}')
obs_per_day = 8 # we do 8 observations a day
days = 5 * 365 # 5 years of observations
total_num_obs = round(obs_per_day * days * average_obs) # we must round - number of obs must be an integer
print(f'total_num_obs = {total_num_obs}')# we assume 12 interesting numbers in range 000000 -> 999999 (000000, 111111, 222222, ... 999999, 123456, 654321)
interesting_numbers = 12
total_numbers = 1000000
p_interesting_observation = interesting_numbers/total_numbers
print(f'p_interesting_observation = {p_interesting_observation}')# now for the fun part
import numpy as np
from scipy import stats# we model observations of an interesting number
# as a Binomial variable
# A binomial varibale gives us the probability of getting 'x'
# results out of 'n' observations
# when the probability of getting x is p. Specifically, x=1 for one
# interesting number our of n observations
# We step up a binomial random variable using scipy.stats with this
# p and the number of observations we have made
# with a probability of p of getting an interesting number
binom = stats.binom(p=p_interesting_observation, n=total_num_obs)# we now evalute this random variable for probability of getting 0
# interesting observations.
# its a discrete random variable so we evaluate its probability mass function (pmf) at 0 (observations)
p_0_o = binom.pmf(0)# now lets report some probabilities
print(f'Probability of 0 interesting observations = {p_0_o:.5f}')
# this implies probability of at least 1 interesting obs is 1-p_0_o
print(f'This implies a probability of at least 1 interesting observation = {1-p_0_o:.5f}')
print()
# some other interesting things to note
print(f'Probability of exactly one interesting observation = {binom.pmf(1):.5f}')
print(f'Probability of exactly two interesting observations = {binom.pmf(2):.5f}')
print(f'Probability of exactly three interesting observations = {binom.pmf(3):.5f}')
# make sure the law of total probability is working here
# we sum all probabilities of results from 0 to a large number. This sum should be close to 1.0
print()
s = 0
for i in range(10000):
s += binom.pmf(i)
print(f'Total probability between 0 and 9999 interesting observations = {s:.5f}')